BACK END/Deep Learning
[딥러닝] Decision Tree
circle kim
2021. 3. 17. 13:17
의사결정 나무(Decision Tree)
: CART - classification과 Regression 모두 가능
: 여러 규칙을 순차적으로 적용하면서 분류나 예측을 진행하는 단순 알고리즘 사용 모델
Random Forest
앙상블 모델
base 모델로 Decision Tree
* tree1.py
import pydotplus
from sklearn import tree

# height, hair로 남녀 구분
x = [[180, 15],
     [177, 42],
     [156, 35],
     [174, 5],
     [166, 33]]

y = ['man', 'women', 'women', 'man', 'women']
label_names = ['height', 'hair Legnth']

model = tree.DecisionTreeClassifier(criterion='entropy', random_state=0)
print(model)
fit = model.fit(x, y)
print('acc :{:.3f}'.format(fit.score(x, y))) # acc :1.000

mydata = [[171, 8]]
pred =  fit.predict(mydata)
print('pred :', pred) # pred : ['man']
from sklearn import tree
tree.DecisionTreeClassifier() :
scikit-learn.org/stable/modules/generated/sklearn.tree.DecisionTreeClassifier.html
sklearn.tree.DecisionTreeClassifier — scikit-learn 0.24.1 documentation
scikit-learn.org
# 시각화 - graphviz 툴을 사용
import collections

dot_data = tree.export_graphviz(model, feature_names=label_names, out_file=None,\
                                filled = True, rounded=True)
graph = pydotplus.graph_from_dot_data(dot_data)
colors = ('red', 'orange')
edges = collections.defaultdict(list) # list type 변수

for e in graph.get_edge_list():
    edges[e.get_source()].append(int(e.get_destination()))

for e in edges:
    edges[e].sort()
    for i in range(2):
        dest = graph.get_node(str(edges[e][i]))[0]
        dest.set_fillcolor(colors[i])

graph.write_png('tree.png') # 이미지 저장

import matplotlib.pyplot as plt

img = plt.imread('tree.png')
plt.imshow(img)
plt.show()

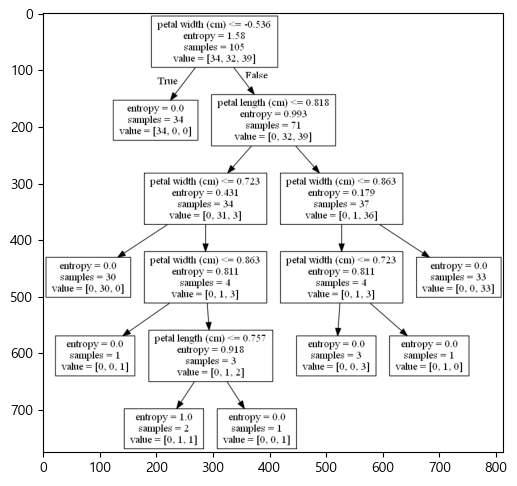
* tree2_iris.py
...

# 의사결정 나무 모델
from sklearn.tree import DecisionTreeClassifier
model = DecisionTreeClassifier(criterion='entropy', max_depth=5)

...
...
# 트리의 특성 중요도 : 전체 트리 결정에 각 특성이 어느정도 중요한지 평가
print('특성 중요도 : \n{}'.format(model.feature_importances_))
def plot_feature_importances(model):
n_features = x.shape[1] # 4
plt.barh(range(n_features), model.feature_importances_, align='center')
#plt.yticks(np.range(n_features), iris.featrue_names[2:4])
plt.xlabel('특성중요도')
plt.ylabel('특성')
plt.ylim(-1, n_features)
plot_feature_importances(model)
plt.show()
# graphviz
from sklearn import tree
from io import StringIO
import pydotplus

dot_data = StringIO() # 파일 흉내를 내는 역할
tree.export_graphviz(model, out_file = dot_data,\
                     feature_names = iris.feature_names[2:4])
graph = pydotplus.graph_from_dot_data(dot_data.getvalue())
graph.write_png('tree2.png')

import matplotlib.pyplot as plt

img = plt.imread('tree2.png')
plt.imshow(img)
plt.show()