24. 연관분석 : 항목간의 연관 규칙을 발견하는 클러스터링 알고리즘의 일종
install.packages("arules")
library(arules)
- arules가 원하는 transaction format 작성 연습
d_list <- list(c('a', 'b'), c('a', 'c'), c('a', 'e'), c('b', 'c', 'e'))
d_list
names(d_list) <- paste0('tr', c(1:4))
d_list
# $tr1
# [1] "a" "b"
#
# $tr2
# [1] "a" "c"
#
# $tr3
# [1] "a" "e"
#
# $tr4
# [1] "b" "c" "e"
tran <- as(d_list, 'transactions')
tran
inspect(tran)
# items transactionID
# [1] {a,b} tr1
# [2] {a,c} tr2
# [3] {a,e} tr3
# [4] {b,c,e} tr4cust <- read.csv("testdata/priori_data2.csv", stringsAsFactors = F)
cust
str(cust)
cust$sangpum[cust$irum=='홍길동']
cust_list <- split(cust$sangpum, cust$irum)
cust_list
# $강감찬
# [1] "감자깡" "새우깡"
#
# $공기밥
# [1] "자갈치" "맛동산"
#
# $신기해
# [1] "코코넛" "맛동산"
#
# $한국인
# [1] "짱구" "감자깡"
#
# $홍길동
# [1] "새우깡" "맥주"
cust_tran <- as(cust_list, 'transactions')
cust_tran
inspect(cust_tran)
# items transactionID
# [1] {감자깡,새우깡} 강감찬
# [2] {맛동산,자갈치} 공기밥
# [3] {맛동산,코코넛} 신기해
# [4] {감자깡,짱구} 한국인
# [5] {맥주,새우깡} 홍길동
# 연관규칙 생성
cust_rules <- apriori(cust_tran)
# confidence minval smax arem aval originalSupport maxtime support minlen maxlen target ext
# 0.8 0.1 1 none FALSE TRUE 5 0.1 1 10 rules TRUE
summary(cust_tran)
inspect(cust_rules)
# lhs rhs support confidence coverage lift count
# [1] {자갈치} => {맛동산} 0.2 1 0.2 2.5 1
# [2] {코코넛} => {맛동산} 0.2 1 0.2 2.5 1
# [3] {짱구} => {감자깡} 0.2 1 0.2 2.5 1
# [4] {맥주} => {새우깡} 0.2 1 0.2 2.5 1 customer <- read.csv("testdata/priori_data.csv", stringsAsFactors = F)
customer
# bunho irum sangpum
# 1 1 홍길동 새우깡
# 2 2 홍길동 맛동산
# 3 3 홍길동 맥주
# 4 4 사오정 짱구
customer$sangpum[customer$irum == '홍길동']
customer_list <- split(customer$sangpum, customer$irum)
customer_list
customer_list <- sapply(customer_list, unique) # 중복 제거
customer_tran <- as(customer_list, 'transactions')
customer_tran
summary(customer_tran)
- 정보 획득
itemFrequency(customer_tran) # 구매 빈도 출력
#    감자깡     맛동산       맥주     새우깡     자갈치       짱구 초코칩쿠키 크라운산도     포카칩
# 0.5000000  0.6666667  0.3333333  0.3333333  0.3333333  0.5000000  0.1666667  0.1666667  0.1666667
itemFrequency(customer_tran[, 1:3])
itemFrequencyPlot(customer_tran)
itemFrequencyPlot(customer_tran, support = 0.3)
itemFrequencyPlot(customer_tran, topN = 3)
- 연관규칙
customer_rules <- apriori(customer_tran)
summary(customer_rules)

inspect(customer_rules)
inspect(sort(customer_rules, by = "lift")[1:5])
#     lhs                    rhs          support   confidence coverage  lift count
# [1] {크라운산도}        => {포카칩}     0.1666667 1          0.1666667 6    1
# [2] {포카칩}            => {크라운산도} 0.1666667 1          0.1666667 6    1
# [3] {맥주,크라운산도}   => {포카칩}     0.1666667 1          0.1666667 6    1
# [4] {맥주,포카칩}       => {크라운산도} 0.1666667 1          0.1666667 6    1
# [5] {새우깡,크라운산도} => {포카칩}     0.1666667 1          0.1666667 6    1
inspect(sort(customer_rules, by = "lift", decreasing = FALSE)[1:5])
inspect(sort(customer_rules, by = "support", decreasing = FALSE)[1:5]) # 지지도

rule_subset <- subset(customer_rules, items %in% c('맛동산', '짱구'))
inspect(rule_subset)
inspect(rule_subset[1:5])
#     lhs                    rhs      support   confidence coverage  lift count
# [1] {초코칩쿠키}        => {맛동산} 0.1666667 1          0.1666667 1.5  1
# [2] {자갈치}            => {맛동산} 0.3333333 1          0.3333333 1.5  2
# [3] {자갈치,초코칩쿠키} => {맛동산} 0.1666667 1          0.1666667 1.5  1
# [4] {맛동산,초코칩쿠키} => {자갈치} 0.1666667 1          0.1666667 3.0  1
# [5] {자갈치,짱구}       => {맛동산} 0.1666667 1          0.1666667 1.5  1
- 시각화
install.packages("arulesViz")
library(arulesViz)
plot(customer_rules)
plot(customer_rules, method = "grouped")
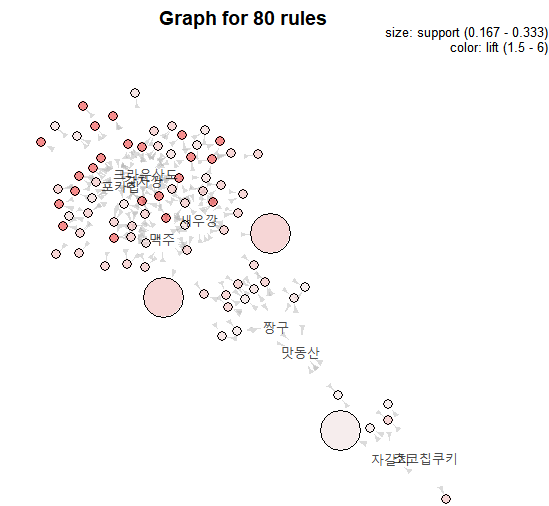
plot(customer_rules, method = "graph") # 원 : 연관관계, 원의 크기 : support, 색상진하기 : lift
plot(customer_rules, method = "graph", control = list(type="items"))
plot(customer_rules, method = "graph", engine = 'interactive')


# 미국 식료품 매장의 판매자료

data("Groceries")
str(Groceries)
Groceries

gdf <- as(Groceries, 'data.frame')
head(gdf)

library(arules)
rules <- apriori(Groceries, parameter = list(supp=0.001, conf=0.8))
inspect(rules)
plot(rules, method="grouped")
rules <- apriori(Groceries, parameter = list(supp=0.001, conf=0.8, maxlen = 3))
inspect(rules)

rules <- sort(rules, decreasing = T, by='confidence')
inspect(rules)

library(arulesViz)
plot(rules, method = 'graph', control = list(type ='items'))
wmilk <- subset(rules, rhs %in% 'whole milk')
inspect(wmilk)
plot(wmilk, method = 'graph')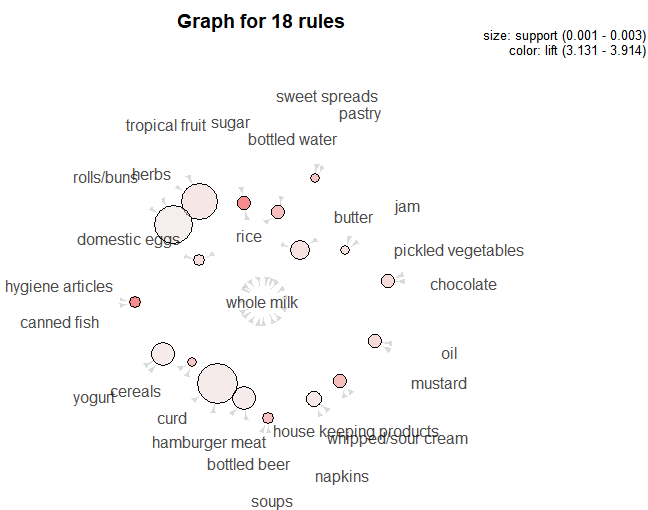
oveg <- subset(rules, rhs %in% 'other vegetables')
inspect(oveg)
plot(oveg, method = 'graph')
b_y <- subset(rules, lhs %in% c('butter', 'yogurt'))
inspect(b_y)
plot(b_y, method = 'graph')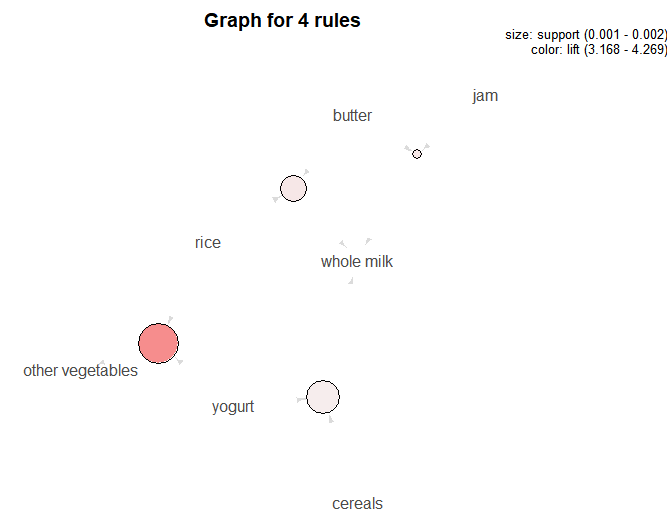
'BACK END > R' 카테고리의 다른 글
| [R] R 정리 23 - 비계층적 군집분석2 (k-means) (0) | 2021.02.05 |
|---|---|
| [R] R 정리 22 - 비계층적 군집분석 (0) | 2021.02.04 |
| [R] R 정리 21 - 계층적 군집분석 (0) | 2021.02.04 |
| [R] R 정리 20 - MLP(deep learning) (0) | 2021.02.04 |
| [R] R 정리 19 - ANN(인공 신경망) (0) | 2021.02.03 |