BACK END/Python Library
[Pandas] pandas 정리2 - db, django
circle kim
2021. 3. 2. 15:23
local db
* db1.py
# sqlite : db 자료 -> DataFrame -> db

import sqlite3

sql = "create table if not exists test(product varchar(10), maker varchar(10), weight real, price integer)"

conn = sqlite3.connect(':memory:')
#conn = sqlite3.connect('mydb.db')
conn.execute(sql)

data = [('mouse', 'samsung', 12.5, 6000), ('keyboard', 'lg', 502.0, 86000)]
stmt = "insert into test values(?, ?, ?, ?)"
conn.executemany(stmt, data)

data1 = ('연필', '모나미', 3.5, 500)
conn.execute(stmt, data1)
conn.commit()

cursor = conn.execute("select * from test")
rows = cursor.fetchall()
for a in rows:
    print(a)
print()
# DataFrame에 저장 1 - cursor.fetchall() 이용
import pandas as pd
#df1 = pd.DataFrame(rows, columns = ['product', 'maker', 'weight', 'price'])
print(*cursor.description)
df1 = pd.DataFrame(rows, columns = list(zip(*cursor.description))[0])
print(df1)# DataFrame에 저장 2 - pd.read_sql() 이용
df2 = pd.read_sql("select * from test", conn)
print(df2)
print()
print(df2.to_html())
print()# DataFrame의 자료를 DB로 저장
data = {
'irum':['신선해', '신기해', '신기한'],
'nai':[22, 25, 27]
}
frame = pd.DataFrame(data)
print(frame)
print()
conn = sqlite3.connect('test.db')
frame.to_sql('mytable', conn, if_exists = 'append', index = False)
df3 = pd.read_sql("select * from mytable", conn)
print(df3)
cursor.close()
conn.close()
교차 테이블(교차표) - 행과 열로 구성된 교차표로 결과(빈도수)를 요약
* cross_test
import pandas as pd

y_true = pd.Series([2, 0, 2, 2, 0, 1, 1, 2, 2, 0, 1, 2])
y_pred = pd.Series([0, 0, 2, 1, 0, 2, 1, 0, 2, 0, 2, 2])

result = pd.crosstab(y_true, y_pred, rownames=['True'], colnames=['Predicted'], margins=True)
print(result)
'''
Predicted  0  1  2  All
True
0          3  0  0    3
1          0  1  2    3
2          2  1  3    6
All        5  2  5   12
'''
# 인구통계 dataset 읽기
des = pd.read_csv('https://raw.githubusercontent.com/pykwon/python/master/testdata_utf8/descriptive.csv')
print(des.info())
# 5개 칼럼만 선택하여 data frame 생성
data = des[['resident','gender','age','level','pass']]
print(data[:5])
# 지역과 성별 칼럼 교차테이블
table = pd.crosstab(data.resident, data.gender)
print(table)
# 지역과 성별 칼럼 기준 - 학력수준 교차테이블
table = pd.crosstab([data.resident, data.gender], data.level)
print(table)
원격 DB 연동
* db2_remote.py
import MySQLdb
import pandas as pd
import numpy as np
import matplotlib.pyplot as plt
plt.rc('font', family='malgun gothic')

import csv
import ast
import sys

try:
    with open('mariadb.txt', 'r') as f:
        config = f.read()
except Exception as e:
    print('read err :', e)
    sys.exit()

config = ast.literal_eval(config)
print(config)
# {'host': '127.0.0.1', 'user': 'root', 'password': '123', 'database': 'test',
# 'port': 3306, 'charset': 'utf8', 'use_unicode': True}
try:
conn = MySQLdb.connect(**config)
cursor = conn.cursor()
sql = """
select jikwon_no, jikwon_name, jikwon_jik, buser_name, jikwon_gen, jikwon_pay
from jikwon inner join buser
on jikwon.buser_num = buser.buser_no
"""
cursor.execute(sql)
for (jikwon_no, jikwon_name, jikwon_jik, buser_name, jikwon_gen, jikwon_pay) in cursor:
print(jikwon_no, jikwon_name, jikwon_jik, buser_name, jikwon_gen, jikwon_pay) # jikwon.csv 파일로 저장
with open('jikwon.csv', 'w', encoding='utf-8') as fw:
writer = csv.writer(fw)
for row in cursor:
writer.writerow(row)
print('저장성공') # csv 파일 읽기 1
df1 = pd.read_csv('jikwon.csv', header=None, names = ('번호', '이름', '직급', '부서', '성별', '연봉'))
print(df1.head(3))
print(df1.shape) # (30, 6) # csv 파일 읽기 2
df2 = pd.read_sql(sql, conn)
df2.columns = ('번호', '이름', '직급', '부서', '성별', '연봉')
print(df2.head(3))
'''
번호 이름 직급 부서 성별 연봉
0 1 홍길동 이사 총무부 남 9900
1 2 한송이 부장 영업부 여 8800
2 3 이순신 과장 영업부 남 7900
''' print('건수 :', len(df2))
print('건수 :', df2['이름'].count()) # 건수 : 30
print()
print('직급별 인원 수 :\n', df2['직급'].value_counts())
print()
print('연봉 평균 :\n', df2.loc[:,'연봉'].sum() / len(df2))
print('연봉 평균 :\n', df2.loc[:,'연봉'].mean())
print()
print('연봉 요약 통계 :\n', df2.loc[:,'연봉'].describe())
print()
print('연봉이 8000이상 : \n', df2.loc[df2['연봉'] >= 8000])
print()
print('연봉이 5000이상인 영업부 : \n', df2.loc[(df2['연봉'] >= 5000) & (df2['부서'] == '영업부')])
print()
print('* crosstab')
ctab = pd.crosstab(df2['성별'], df2['직급'], margins=True)
print(ctab)
print()
print('* groupby')
print(df2.groupby(['성별', '직급'])['이름'].count())
print()
print('* pivot table')
print(df2.pivot_table(['연봉'], index=['성별'], columns=['직급'], aggfunc = np.mean))
print() # 시각화 - pie 차트
# 직급별 연봉 평균
jik_ypay = df2.groupby(['직급'])['연봉'].mean()
print(jik_ypay, type(jik_ypay)) # Series
print(jik_ypay.index)
print(jik_ypay.values)
plt.pie(jik_ypay,
labels=jik_ypay.index,
labeldistance=0.5,
counterclock=False,
shadow=True,
explode=(0.2, 0, 0, 0.3, 0))
plt.show()
except Exception as e:
print('process err :', e)
finally:
cursor.close()
conn.close()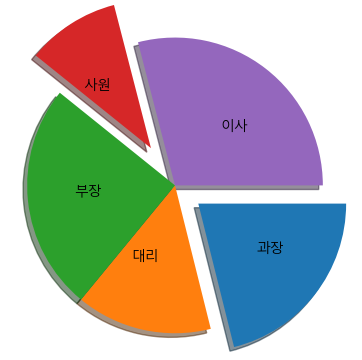
# DataFrame의 자료를 DB로 저장
data = {
    'irum':['tom', 'james', 'john'],
    'nai':[22, 25, 27]
}
frame = pd.DataFrame(data)
print(frame)
print()

# pip install sqlalchemy
# pip install pymysql
from sqlalchemy import create_engine
import pymysql # MySQL Connector using pymysql

pymysql.install_as_MySQLdb()
engine = create_engine("mysql+mysqldb://root:"+"123"+"@Localhost/test", encoding='utf-8')
conn = engine.connect()

# MySQL에 저장하기
# pandas의 to_sql 함수 사용 저장
frame.to_sql(name='mytable', con = engine, if_exists = 'append', index = False)
df3 = pd.read_sql("select * from mytable", conn)
print(df3)
Django
PyDev Django Project 생성
* Django - Create application - myjikwonapp
= django_use01
* settings
...

INSTALLED_APPS = [

    ...

    'myjikwonapp',
]

...

DATABASES = {
    'default': {
        'ENGINE': 'django.db.backends.mysql',
        'NAME': 'test',                # DB명 : db는 미리 작성되어 있어야 함.
        'USER': 'root',                # 계정명
        'PASSWORD': '123',             # 계정 암호
        'HOST': '127.0.0.1',           # DB가 설치된 컴의 ip
        'PORT': '3306',                # DBMS의 port 번호
    }
}
* anaconda prompt
cd C:\work\psou\django_use01
python manage.py inspectdb > aaa.py
* models
from django.db import models

# Create your models here.
class Jikwon(models.Model):
    jikwon_no = models.IntegerField(primary_key=True)
    jikwon_name = models.CharField(max_length=10)
    buser_num = models.IntegerField()
    jikwon_jik = models.CharField(max_length=10, blank=True, null=True)
    jikwon_pay = models.IntegerField(blank=True, null=True)
    jikwon_ibsail = models.DateField(blank=True, null=True)
    jikwon_gen = models.CharField(max_length=4, blank=True, null=True)
    jikwon_rating = models.CharField(max_length=3, blank=True, null=True)

    class Meta:
        managed = False
        db_table = 'jikwon'
* Django - Create Migrations - myjikwonapp
* Django - Migrate
* urls
from django.contrib import admin
from django.urls import path
from myjikwonapp import views

urlpatterns = [
    path('admin/', admin.site.urls),
    path('', views.MainFunc),
    path('showdata', views.ShowFunc),
]
* views
from django.shortcuts import render
from myjikwonapp.models import Jikwon
import pandas as pd
import matplotlib.pyplot as plt
plt.rc('font', family='malgun gothic')

# Create your views here.
def MainFunc(request):
    return render(request, 'main.html')

def ShowFunc(request):
    #datas = Jikwon.objects.all()         # jikwon table의 모든 데이터 조회
    datas = Jikwon.objects.all().values() # dict type
    #print(datas)                         # <QuerySet [{'jikwon_no': 1, 'jikwon_name': '홍길동', ...

    pd.set_option('display.max_columns', 500) # width : 500
    df = pd.DataFrame(datas)
    df.columns = ['사번', '직원명','부서코드', '직급', '연봉', '입사일', '성별', '평점']
    #print(df)
    '''
            사번  직원명  부서코드  직급    연봉         입사일 성별 평점
    0    1  홍길동    10  이사  9900  2008-09-01  남  a
    1    2  한송이    20  부장  8800  2010-01-03  여  b
    2    3  이순신    20  과장  7900  2010-03-03  남  b
    3    4  이미라    30  대리  4500  2014-01-04  여  b
    4    5  이순라    20  사원  3000  2017-08-05  여  b
    '''

    # 부서별 급여 합/평균
    buser_group = df['연봉'].groupby(df['부서코드'])
    buser_group_detail = {'sum':buser_group.sum(), 'avg':buser_group.mean()}
    #print(buser_group_detail)
    '''
    {'sum': 부서코드
    10    37900
    20    58900
    30    37300
    40    25050,
    'avg': 부서코드
    10    5414.285714
    20    4908.333333
    30    5328.571429
    40    6262.500000
    }
    '''

    # 차트를 이미지로 저장
    bu_result = buser_group.agg(['sum', 'mean'])
    bu_result.plot.bar()
    #bu_result.plot(kind='bar')
    plt.title("부서별 급여 합/평균")
    fig = plt.gcf()
    fig.savefig('django_use01/myjikwonapp/static/images/jik.png')

    return render(request, 'show.html', {'msg':'직원정보', 'datas':df.to_html(), 'buser_group':buser_group_detail})
* main.html
<body>
 <h2>메인</h2>
 <a href="showdata">직원정보</a>
</body>
* show.html
<body>
  <h2>{{msg}} (DB -> pandas 이용)</h2>
  {% if datas %}
  {{datas|safe}}
  {% endif %}
  <hr>
  <h2>부서별 급여합</h2>
  총무부 : {{buser_group.sum.10}}<br>
  영업부 : {{buser_group.sum.20}}<br>
  전산부 : {{buser_group.sum.30}}<br>
  관리부 : {{buser_group.sum.40}}<br><br>
  <h2>부서별 급여평균</h2>
  총무부 : {{buser_group.avg.10}}<br>
  영업부 : {{buser_group.avg.20}}<br>
  전산부 : {{buser_group.avg.30}}<br>
  관리부 : {{buser_group.avg.40}}<br><br>
  <img alt="사진" src="/static/images/jik.png" title="차트 1-1">
</body>
* desc_stat
# 기술 통계
'''
기술통계(descriptive statistics)란 수집한 데이터의 특성을 표현하고 요약하는 통계 기법이다.
기술통계는 샘플(전체 자료일수도 있다)이 있으면, 그 자료들에 대해  수치적으로 요약정보를 표현하거나,
데이터 시각화를 한다.
즉, 자료의 특징을 파악하는 관점으로 보면 된다. 평균, 분산, 표준편차 등이 기술통계에 속한다.
'''

# 도수 분포표
import pandas as pd

frame = pd.read_csv('../testdata/ex_studentlist.csv')
print(frame.head(2))
print(frame.info())
'''
  name sex  age  grade absence bloodtype  height  weight
0  김길동  남자   23      3       유         O   165.3    68.2
1  이미린  여자   22      2       무        AB   170.1    53.0
'''
print('나이\t:', frame['age'].mean())
print('나이\t:', frame['age'].var())
print('나이\t:', frame['age'].std())
print('혈액형\t:', frame['bloodtype'].unique())
print(frame.describe().T)
print()

# 혈액형별 인원수
data1 = frame.groupby(['bloodtype'])['bloodtype'].count()
print('혈액형별 인원수 : ', data1)
'''
혈액형별 인원수 :  bloodtype
A     3
AB    3
B     4
O     5
'''
print()

data2 = pd.crosstab(index = frame['bloodtype'], columns = 'count')
print('혈액형별 인원수 : ', data2)
'''
혈액형별 인원수 :  col_0      count
bloodtype
A              3
AB             3
B              4
O              5
'''
print()

# 성별, 혈액형별 인원수
data3 = pd.crosstab(index = frame['bloodtype'], columns = frame['sex'])
data3 = pd.crosstab(index = frame['bloodtype'], columns = frame['sex'], margins=True) # 소계
data3.columns = ['남', '여', '행합']
data3.index = ['A', 'AB', 'B', 'O', '열합']
print('성별, 혈액형별 인원수 : ', data3)
'''
성별, 혈액형별 인원수 :      남  여  행합
A   1  2   3
AB  2  1   3
B   3  1   4
O   2  3   5
열합  8  7  15
'''
print()

print(data3/data3.loc['열합','행합'])
print()
'''
           남         여        행합
A   0.066667  0.133333  0.200000
AB  0.133333  0.066667  0.200000
B   0.200000  0.066667  0.266667
O   0.133333  0.200000  0.333333
열합  0.533333  0.466667  1.000000
'''